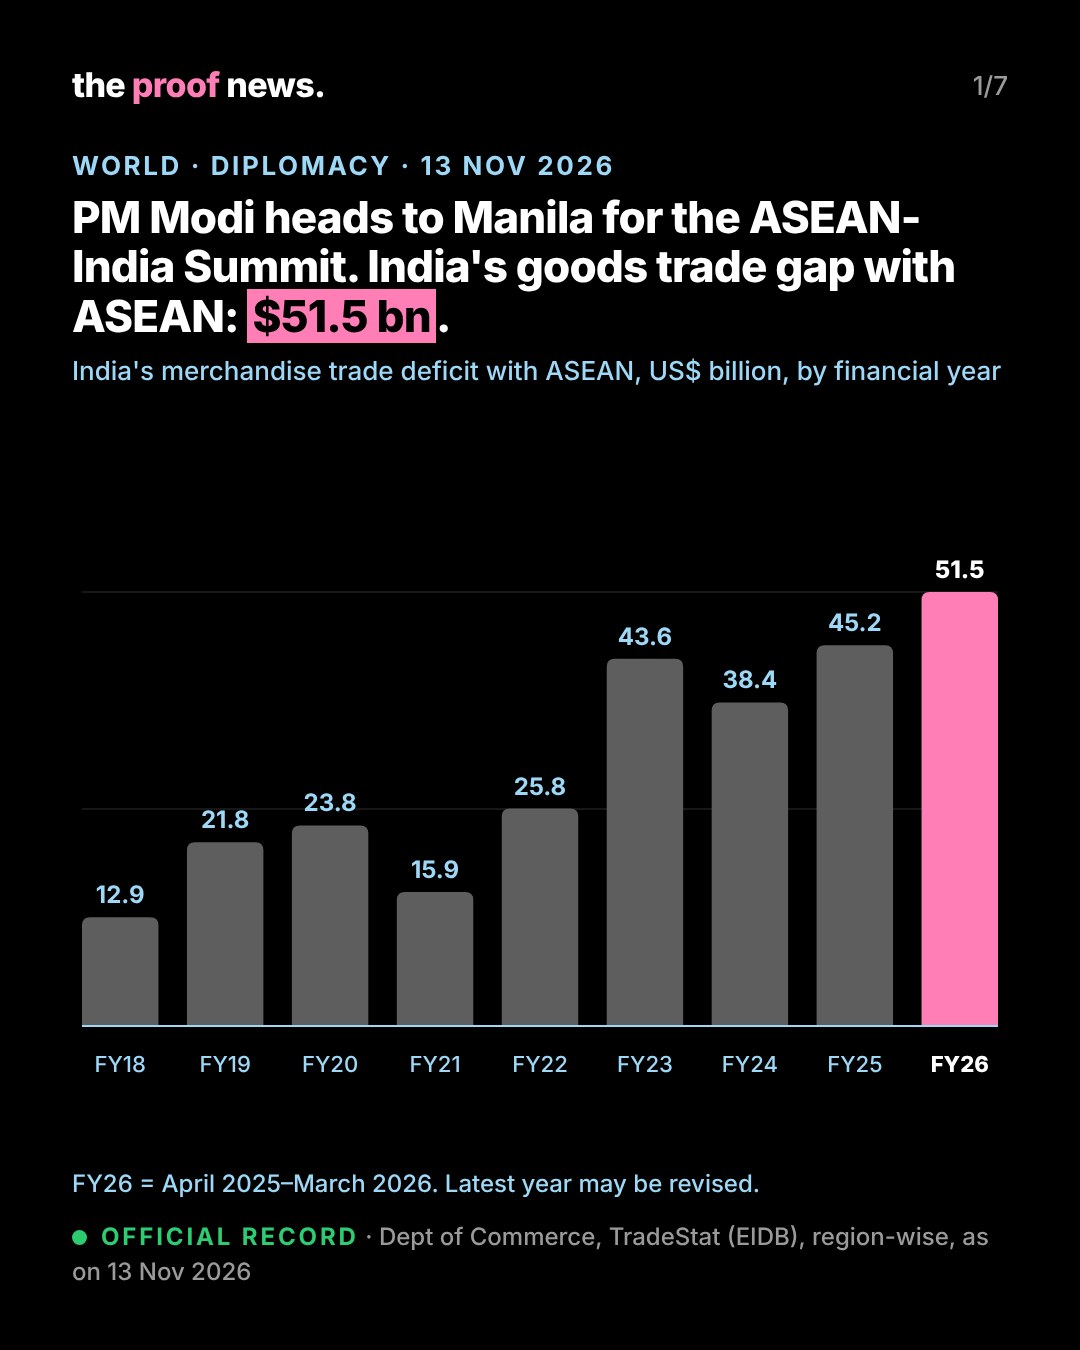
PM Modi to visit Manila for ASEAN-India and East Asia Summits; India's goods trade gap with ASEAN at $51.5 billion
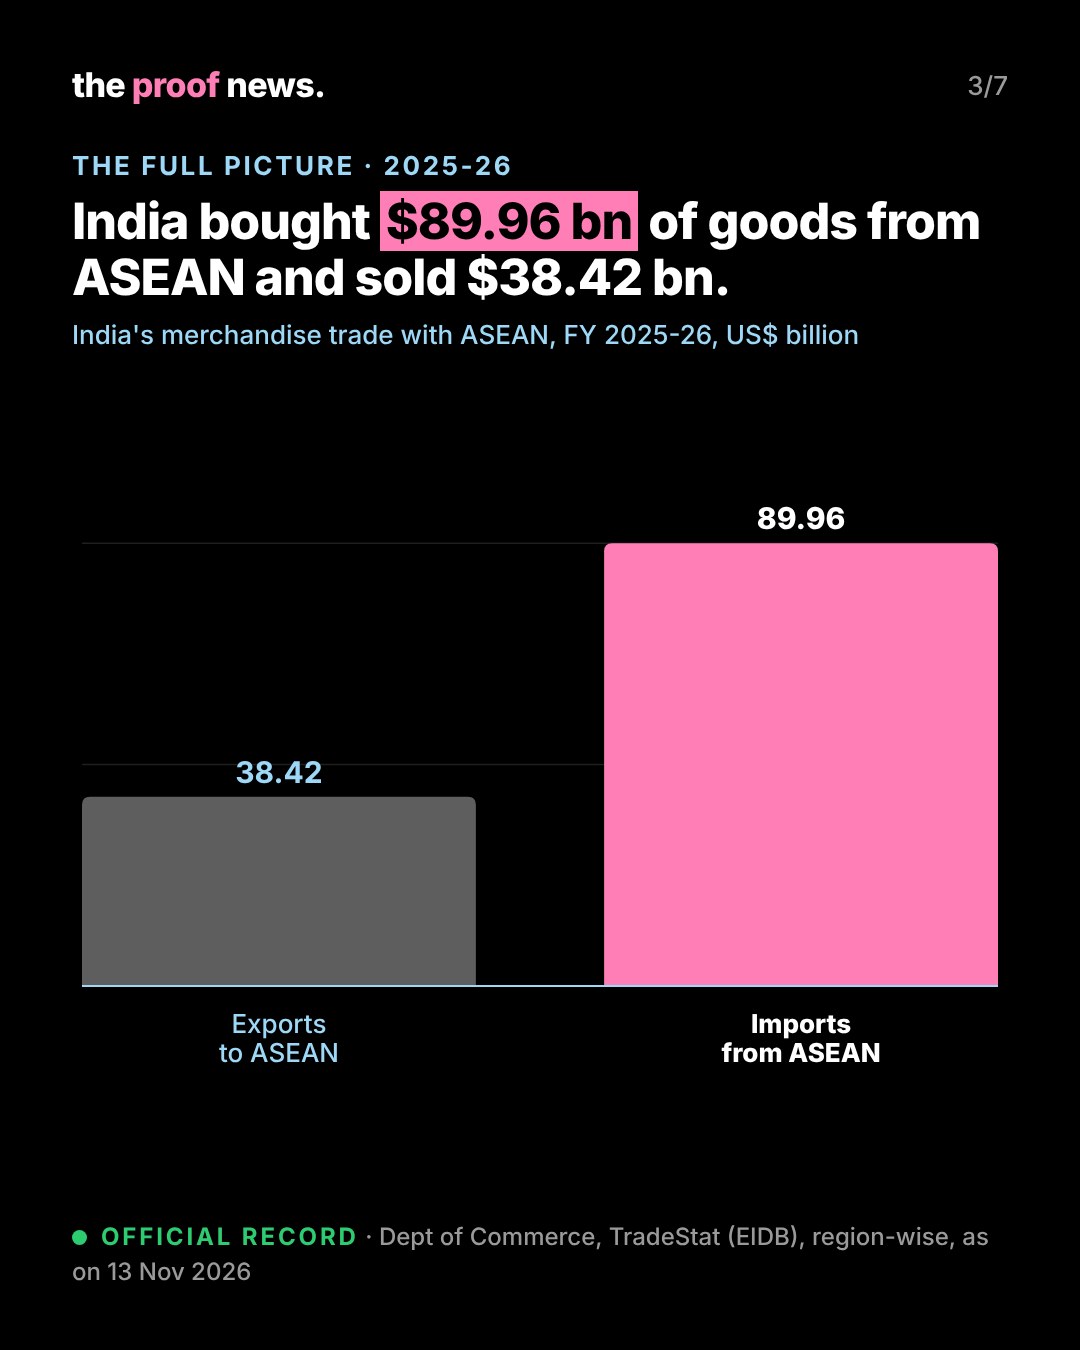
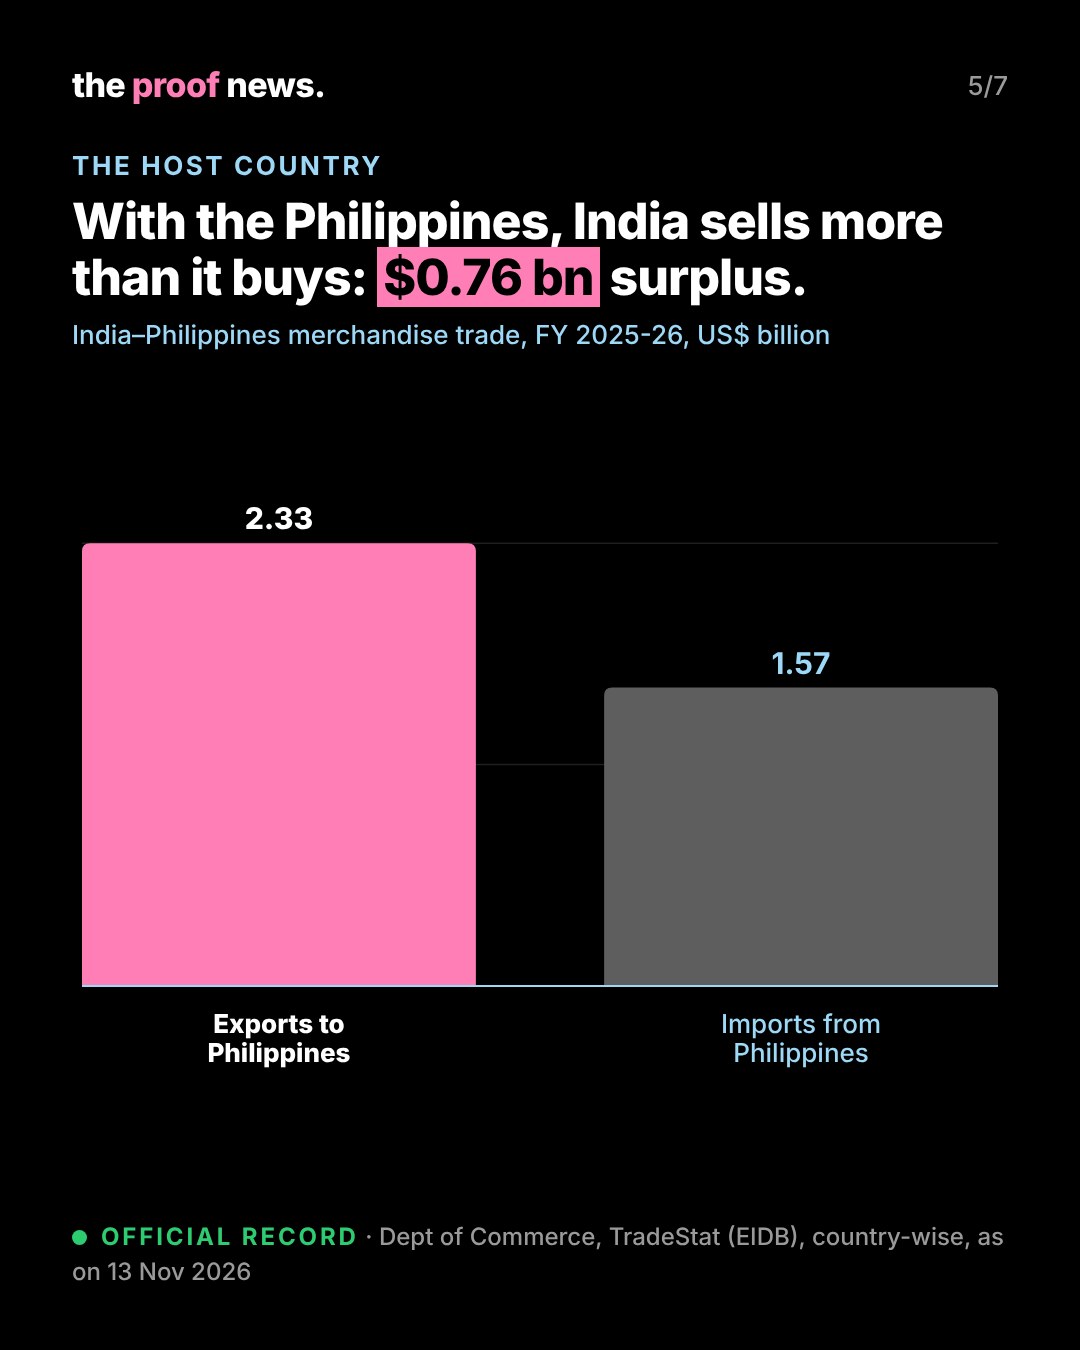
India bought $89.96 billion of goods from ASEAN in 2025-26 and sold $38.42 billion. With the host, the Philippines, India runs a surplus.


Official recordPrime Minister Narendra Modi will visit Manila, Philippines, from 16 to 17 November 2026 at the invitation of President Ferdinand R. Marcos Jr. He will take part in the 23rd ASEAN-India Summit and the 21st East Asia Summit, both on 17 November, hosted by the Philippines as ASEAN Chair for 2026 (PMO release, PIB ID 2335665, 12 Nov 2026).
Official recordAccording to the release, the ASEAN-India Summit will review the Comprehensive Strategic Partnership, including the ASEAN-India Plan of Action 2026-2030. 2026 is the ASEAN-India Year of Maritime Cooperation; 2027 marks 35 years of Dialogue Relations.
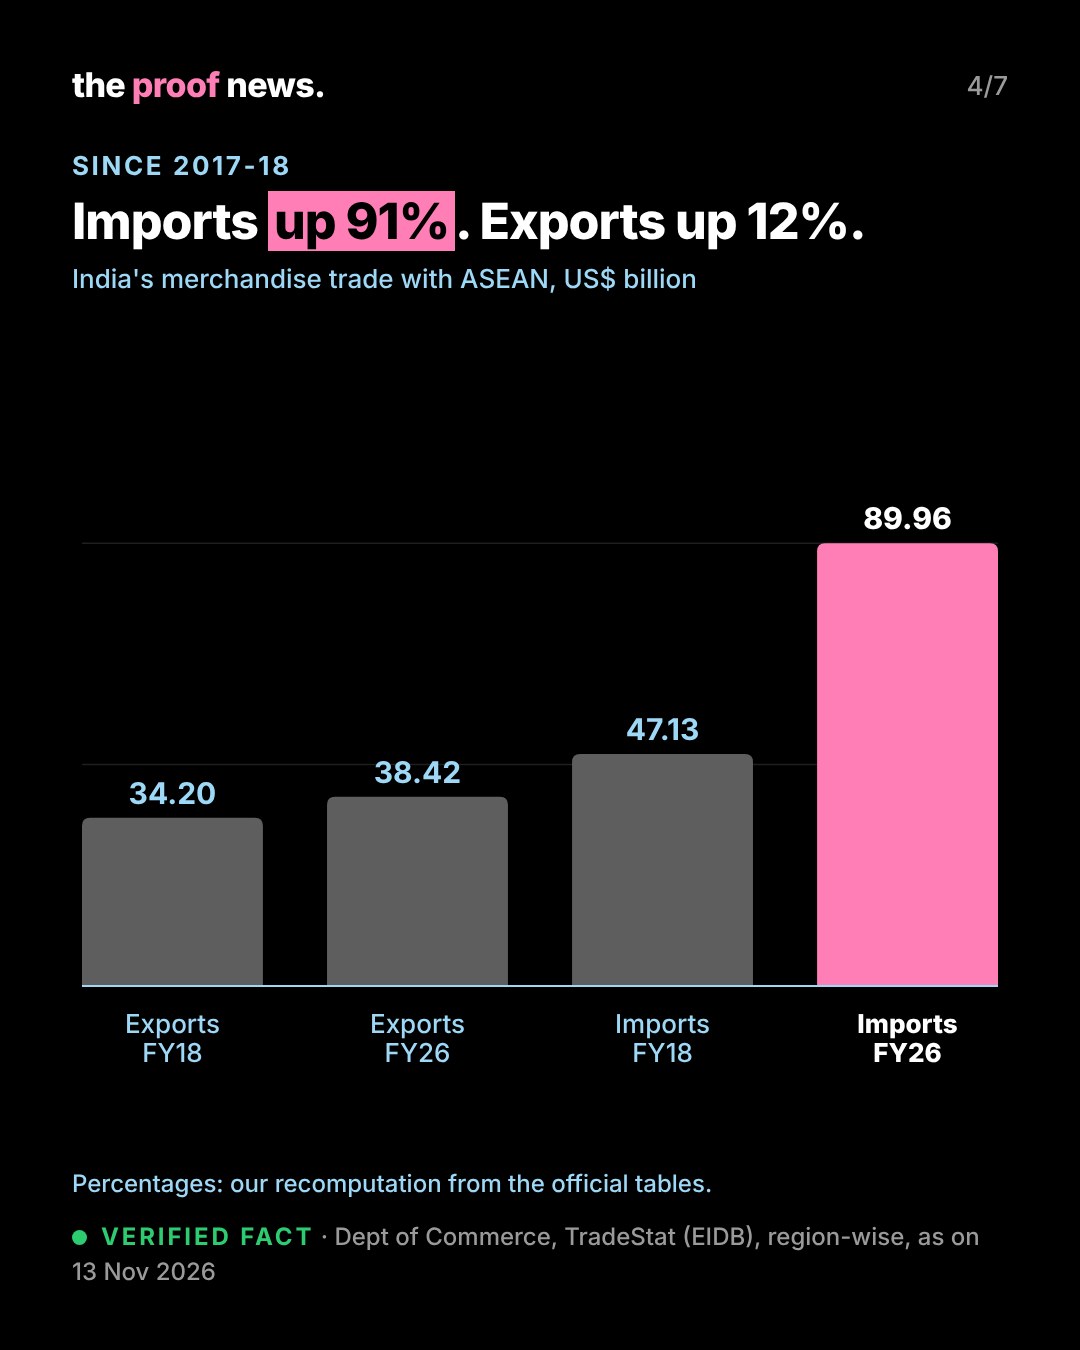
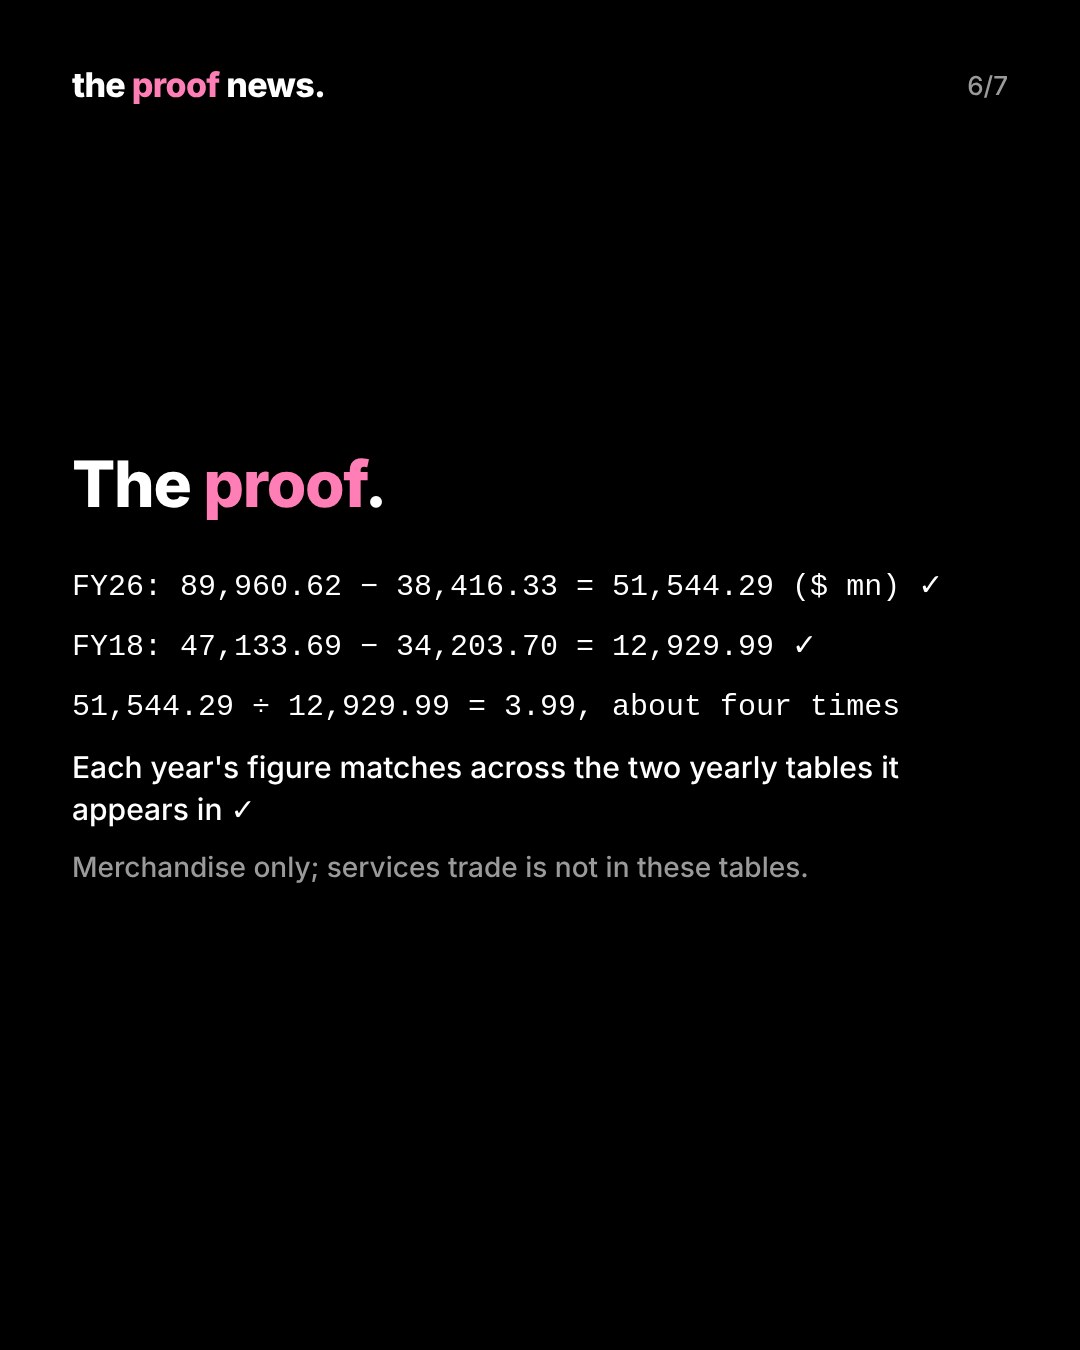
Official recordTrade: in 2025-26 India exported $38.42 billion of goods to ASEAN and imported $89.96 billion, a deficit of $51.5 billion. In 2017-18 the figures were $34.20 billion, $47.13 billion and $12.9 billion (Department of Commerce, TradeStat, region-wise data, as on 13 Nov 2026).
Verified factBy our recomputation, imports from ASEAN rose 91% between 2017-18 and 2025-26 and exports 12%; the deficit is about four times its 2017-18 level (ratio 3.99).
Official recordWith the Philippines, India exported $2.33 billion and imported $1.57 billion in 2025-26, a surplus of $0.76 billion (TradeStat, country-wise).
CommentaryCaveats: these are merchandise figures only; services trade is not included. The latest year can be revised. A deficit reflects many factors, including what India imports (the tables do not explain causes).
UnverifiedNot yet known: what the summit will announce, and whether bilateral meetings will be held; the release does not list them.
The proof.
Every trade figure recomputed from the Department of Commerce tables for each year from 2017-18 to 2025-26; each year's value matches across the two yearly tables it appears in; differences and growth rates recomputed on unrounded values.